Prices are finding their footing
Citywide measures cluster around the low-$500,000s. Different data providers tell slightly different stories because a typical home-value estimate and a median closed sale measure different things.
LOCAL PERSPECTIVE / SEPTEMBER 2026
An established city.
A changing housing market.
Explore the prices, ownership costs, and neighborhood changes shaping the next chapter of Plano real estate.
Explore the marketA reading guide to the supplied 2026 market report.
View data notes and sources
$490–530K
Across the report’s citywide sources
2.9–3.5
More choice than the pandemic peak
22–43
Varies by location and price point
01 / THE MARKET
The report describes a market moving beyond bidding-war conditions, with location, condition, and monthly cost carrying more weight.
Citywide measures cluster around the low-$500,000s. Different data providers tell slightly different stories because a typical home-value estimate and a median closed sale measure different things.
The report says more than 42% of listings had a price reduction. Updated, well-positioned homes compete differently from properties needing substantial work.
Owners with older, lower-rate mortgages may be reluctant to move. Plano’s mature housing stock and limited open land make infill and redevelopment particularly relevant.
A citywide median is a starting point. Nearby comparable sales, property condition, and the exact location tell a more useful story.
02 / A MARKET OF NEIGHBORHOODS
From East Plano to the Legacy corridor, the report shows a wide spread in pricing. Compare the figures without losing sight of the homes behind them.
| ZIP / area | Median sale price | Days on market | Sale-to-list | Annual change |
|---|---|---|---|---|
| 75074 East Plano | $380K–405K | ~26 days | 97.5% | Flat |
| 75023 Central / East | $464,799 | 35 days | 98.7% | +6.9% |
| 75075 Central Plano | $459,801 | 33 days | 97.1% | −3.7% |
| 75025 Central / West | $574,751 | 41 days | 97.9% | +2.6% |
| 75024 West Plano | $599,740 | 39 days | 96.8% | −5.9% |
| 75093 West Plano | $849,000 | 19 days | 98.2% | +17.1% |
Figures are approximate and drawn from the supplied report, not a live MLS feed. Luxury sales can change the monthly mix substantially, particularly in 75093. A ZIP code does not establish a school attendance boundary. Sale-to-list definitions may differ by source.
Approximate share of sales in the report
Entry-level inventory is limited. Older homes make up much of this segment.
The market’s center of gravity. Updates and condition shape the competition.
Location and proximity to employment play a prominent role.
A property-specific market driven by architecture, lots, and amenities.
03 / THE COST OF OWNERSHIP
A home’s monthly cost includes more than its mortgage payment. Taxes and insurance deserve their own line in the budget.
U.S. 30-year fixed mortgage average
Freddie Mac · September 17, 2026 ↗
A national benchmark is not a personalized loan quote. Financing terms, exemptions, coverage, and the property itself can materially change the result.
$530,000 purchase price; 20% down ($106,000); $424,000 loan; 30-year fixed term; 6.95% interest. Principal and interest use a standard fully amortizing monthly payment.
Tax assumption: 1.71% of the full purchase price annually, before exemptions. Insurance assumption: $4,529 per year from the report’s Texas estimate, not a Plano quote. Excludes HOA dues, maintenance, utilities, closing costs, and mortgage insurance. Displayed figures are rounded.
ILLUSTRATIVE MONTHLY COST
Not a quote$3,939/ month
For a $530,000 home with 20% down
Calculated from the assumptions shown. Taxes are before exemptions; actual bills and premiums vary.
The Texas Comptroller lists a $140,000 school-district residence homestead exemption for qualifying homeowners. It applies to school taxes, not uniformly to every taxing entity. See eligibility ↗
The report highlights wind and hail exposure as a major cost concern. Read the deductible and roof settlement terms carefully; a percentage deductible may be based on the insured dwelling limit, not the home’s purchase price.
04 / PLANO’S NEXT CHAPTER
The report’s development watchlist spans former malls, corporate campuses, and remaining agricultural parcels. These plans point toward more mixed-use places to live and work.
Development watchlist · Scale and descriptions below are reported plans, not confirmation of completion. Project scope and timing can change.
$1B reported redevelopment
A former mall reimagined as a mixed-use district. The report describes retail, offices, townhomes, apartments, and public open space across 115 acres.
$4B reported investment
A proposed life-sciences and advanced-manufacturing hub. The report outlines a multi-phase transformation of more than 91 acres.
54 reported acres
The report places AT&T’s planned global headquarters in Plano’s Legacy area, with a target relocation by 2028.
107 reported acres
A retail property in transition. The report describes a potential mix of entertainment, hospitality, and residential uses.
$750M reported development
The report identifies a 142-acre mixed-use project bringing townhomes, apartments, and commercial space to a former farm.
215 reported acres
A former dairy farm considered for a mix of single-family and multifamily housing, with open space included in the report’s plan.
Redevelopment may influence demand and amenities, but it does not guarantee price appreciation or protect a property from market declines.
05 / COMMUNITY & HOUSING
Aging in place, school enrollment, and housing costs are closely connected in the report’s account of Plano.
06 / THE OUTLOOK
The report’s central theme is a transition from rapid appreciation to a market shaped by carrying costs, limited resale supply, and redevelopment. Its modest-growth outlook is a scenario, not a promise.
Mortgage rates, employment, project delivery, and the condition of individual homes will help determine what comes next. For any decision, use recent comparable sales and property-specific costs.
ABOUT THIS EDITION
September 2026
Prepared for David McElroy
This website adapts the supplied “The State of the Residential Real Estate Market in Plano, Texas: 2026 Comprehensive Analysis.” Citywide figures, ZIP-code comparisons, price-tier shares, development scales, and community observations come from that report. Open the shared report ↗
The supplied text did not contain direct citations for its market datasets. Those figures are presented as report estimates and have not been independently verified against MLS records. Source periods, property coverage, and definitions differ. This edition is static and does not update automatically.
References checked September 20, 2026.
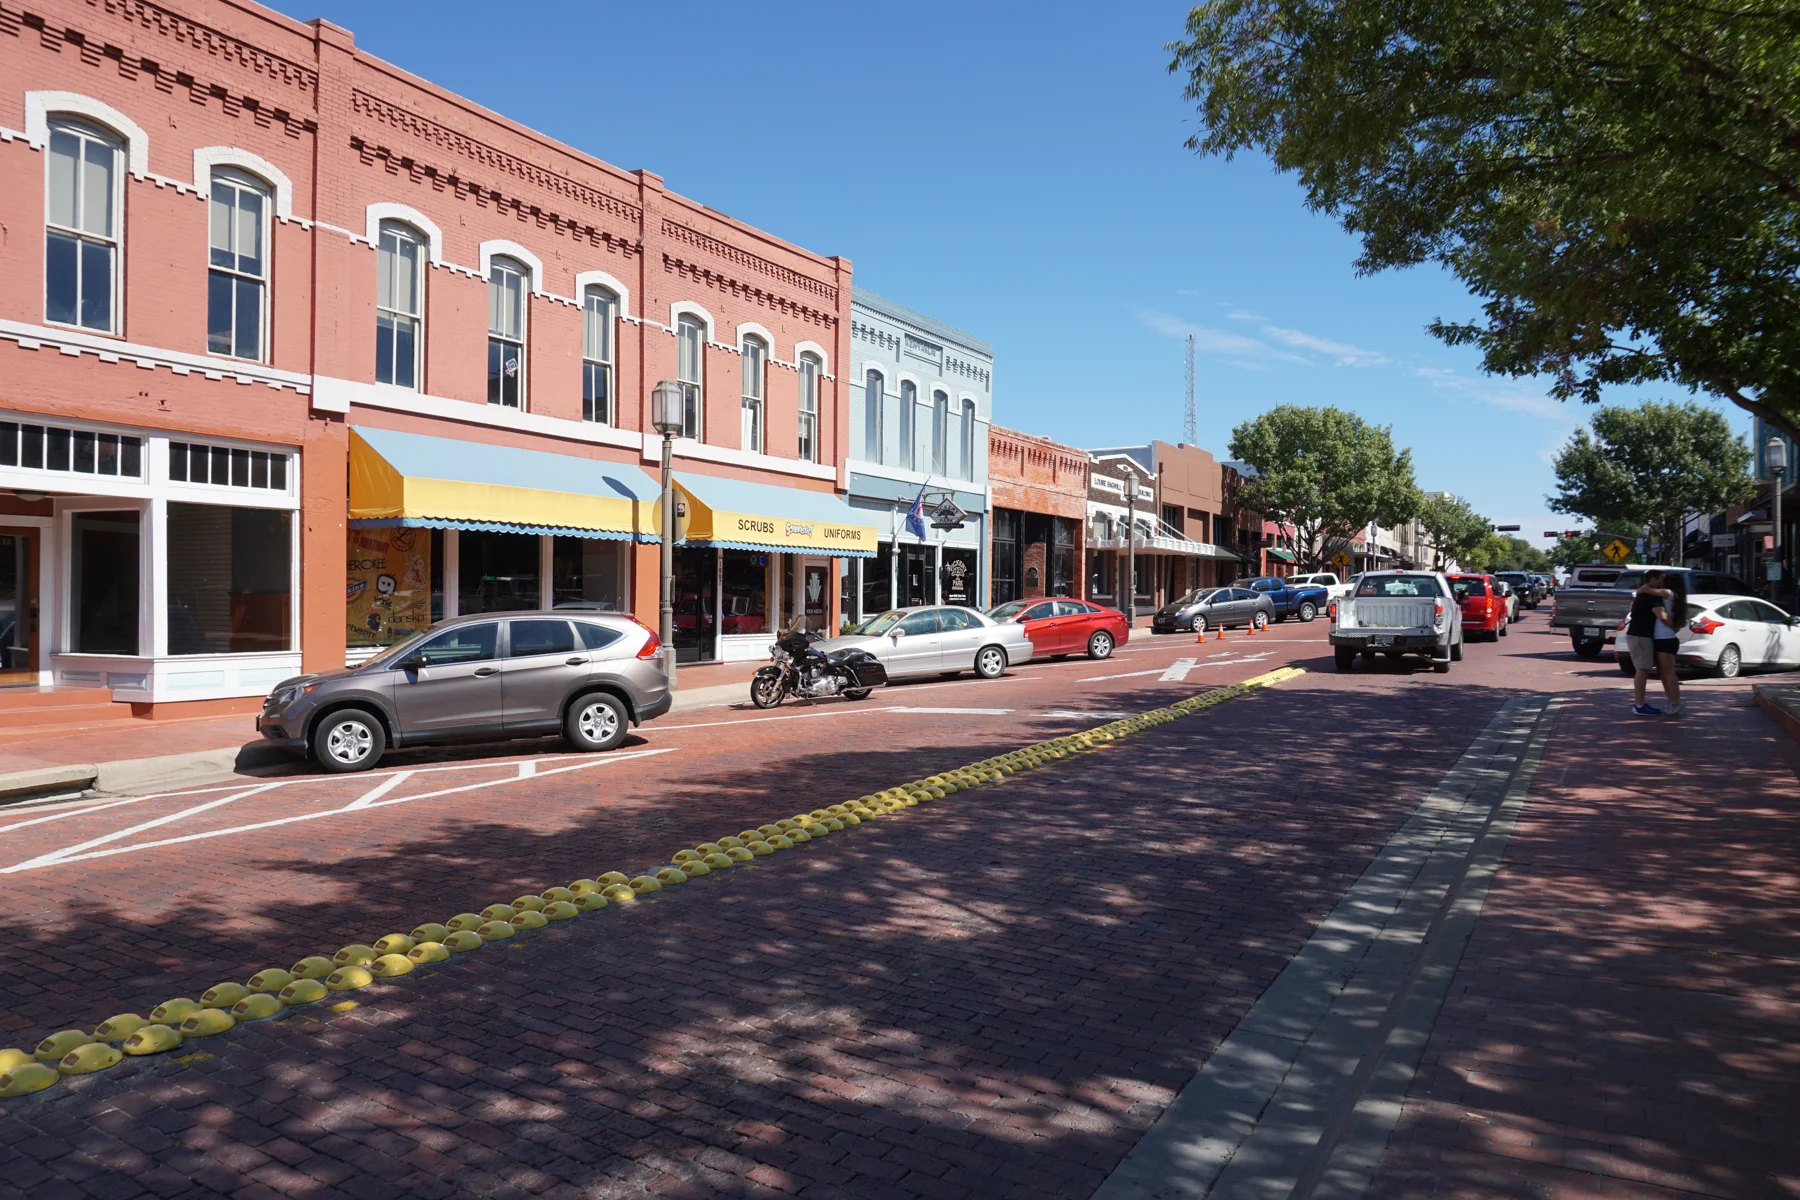
Downtown Plano photograph: Michael Barera / Wikimedia Commons, October 10, 2015, licensed under CC BY-SA 4.0. Resized, converted to WebP, and cropped in the page layout. The image remains available under the same license.
This guide provides general market context. It is not an appraisal, loan offer, tax determination, or legal opinion. Obtain current property-specific information before making a transaction decision.
